
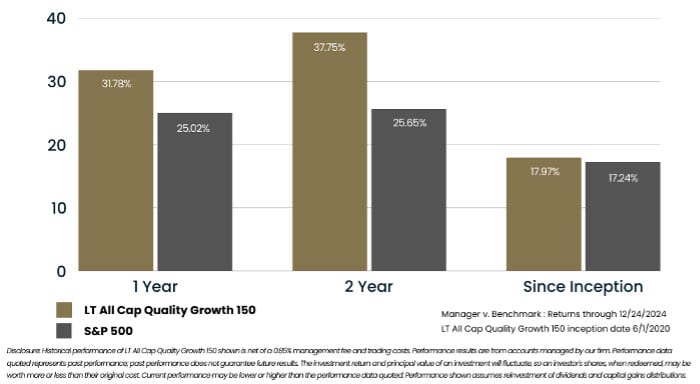
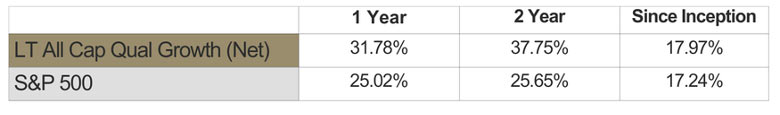
Investors understand that high quality companies are more likely to do better over the long-term compared to unhealthy ones. That’s why Linden Thomas & Company set out to build a better index with a focus on Earnings Quality, unlike the passive, pooled index funds that hold stocks based only on size. Below, you’ll see the results of our Earnings Focused Growth index compared to the market since launch.
However, the timing can impact investors’ perception of results by luring investors to ignore the long-term trend, choosing instead to focus on short-term pullbacks. Below is a chart of a 60/40 portfolio since 2006. Keep in mind that this includes the Great Financial Crisis, COVID, and the aggressive interest rate hiking by the Fed in 2022.
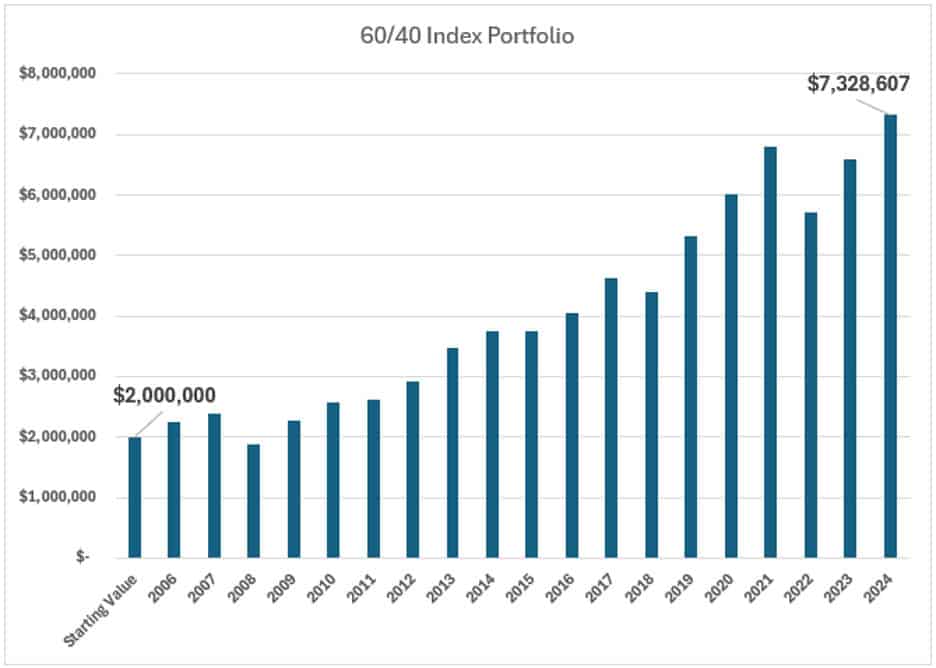
Source: Zephyr StyleAdvisor. Portfolio constructed using 30% S&P 500 index, 10% EAFE index, 10% Russell Midcap index, 10% Russell Small-Cap index, and 40% Bloomberg Barclays U.S. Aggregate Bond index.
The above chart illustrates that the long-term trend is clear, and that even a moderately conservative portfolio like this has historically captured substantial upside.
What Is Timing Bias?
Timing bias is a psychological tendency for investors to evaluate the success of their investments based on the point in the market cycle at which they entered. Essentially, when you start investing can skew your perception of portfolio performance, especially over shorter time horizons.
For example, an investor who began their journey at the market highs of 2021 and saw a subsequent downturn in 2022 might feel that their investment strategy failed them. However, this perception doesn’t account for the natural ebb and flow of market cycles.
It’s a bit like judging a baseball player’s performance based on the inning you arrived at the stadium. If you walked in right before a strikeout, you might judge the player harshly because you didn’t see the two home runs that came earlier in the game. The full picture gets lost, and investors discount the likelihood of that batter hitting more home runs in the future.
Historical Examples of Timing Bias
To better illustrate the impact of timing bias, let’s take a closer look at several historical periods where deployment timing dramatically affected investors’ perceived performance.
Below showcases the same balanced portfolio during deep downturns. Notice how the 1-year, 3-year, and even 5-year averages are skewed lower by recent performance, but over time the averages always returned to normal (in green).
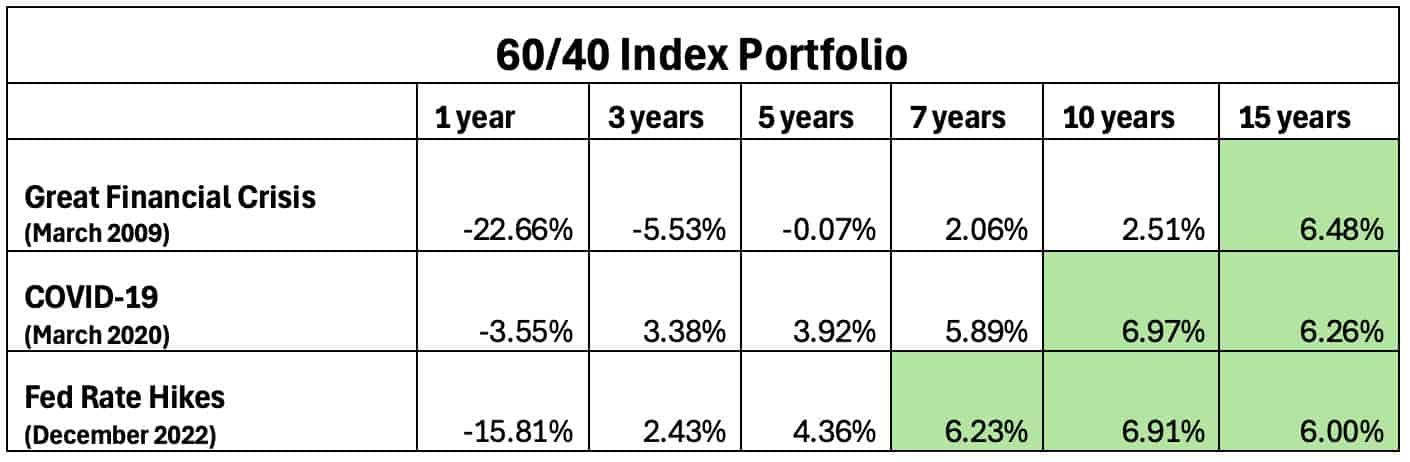
Source: Zephyr StyleAdvisor. Portfolio constructed using 30% S&P 500 index, 10% EAFE index, 10% Russell Midcap index, 10% Russell Small-Cap index, and 40% Bloomberg Barclays U.S. Aggregate Bond index.
Investors who allow their attention to become fixated on recent performance instead of the long-term trend are often misled to believe that their portfolio is inadequate, or that they need to make changes to their approach. In reality, the problem is timing bias – choosing to focus on short-term results.
Why Chasing Performance Rarely Works
When an investor reacts to timing bias by chasing past performance, they fall into a trap we call “bad investor behavior.” It’s a behavior driven by recency bias and emotion. This is particularly dangerous in volatile markets, where yesterday’s winners are often tomorrow’s laggards.
Ironically, by attempting to correct for what they perceive as a past mistake, investors often make new ones–selling assets at depressed prices (i.e. small investor herding) and reallocating to sectors or strategies that may already be peaking.
This behavior also disrupts long-term planning. It is important to build a portfolio not based on chasing momentum but on a balance of risk, return potential, and personal financial goals. Reacting to timing bias can derail this carefully constructed plan.
The Long-Term Perspective: The Antidote to Timing Bias
The most powerful tool investors have to combat timing bias is a long-term perspective. Markets are inherently cyclical. Ups and downs are inevitable. What matters most is not where the market goes in the next quarter, but whether your investment strategy is designed to meet your financial goals over years and decades.
If your entry point into the market happens to be just prior to a pullback, it may take longer to see strong returns. Similarly, entering at a market low may provide early tailwinds, but should not create unrealistic long-term expectations.
To use a metaphor, investing is like planting a tree. Some days you plant in sunshine, some in rain. Both are a natural part of the growing process. What matters is that the tree is nurtured, rooted in good soil, and given time to grow.
Conclusion
The most important thing to consider with time bias is that if you invest and soon thereafter the markets move down the impact of the down markets not only impacts the current results but also will impact total returns for months or years in the future. As the portfolio’s principle increases you may be on the way to recovery, but the average returns will still lag behind. The further you move away in years from a down market the impact to the down market is smoothed out which lifts average return results.
Why is this important and what should an investor do? If investors have a quality portfolio that is well-balanced and efficient one should stay the course. In other words, selling out of quality holdings to seek other options may feel good at the time, but often doesn’t add value and in some cases can hurt future results. Consider this – down markets impact even the healthiest companies so when down markets take place (which they will) the most resent down-market impact will not only impact the current results but the long-term average results. Remember, average return results can be deceiving because short term rallies and down markets impact the average returns which can often create a desire to chase or run to safety. This is why one should only refer to the portfolio average return results over long periods of time and over full-market cycles.
The charts below are a final illustration of how short-term average returns are skewed by where you are in the market cycle. Whether it’s the COVID-19 down market or the 2022 Fed induced down market, you can see that the picture at the highs versus the lows is much more consistent if you are paying attention to the long-term averages instead of recent results.
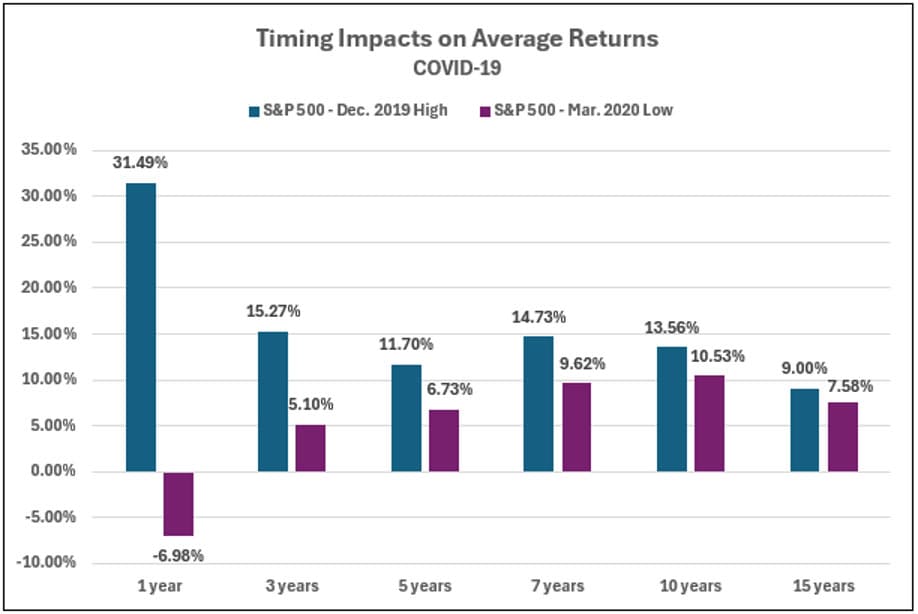
Source: Zephyr (Past Performance is no guarantee of future results)
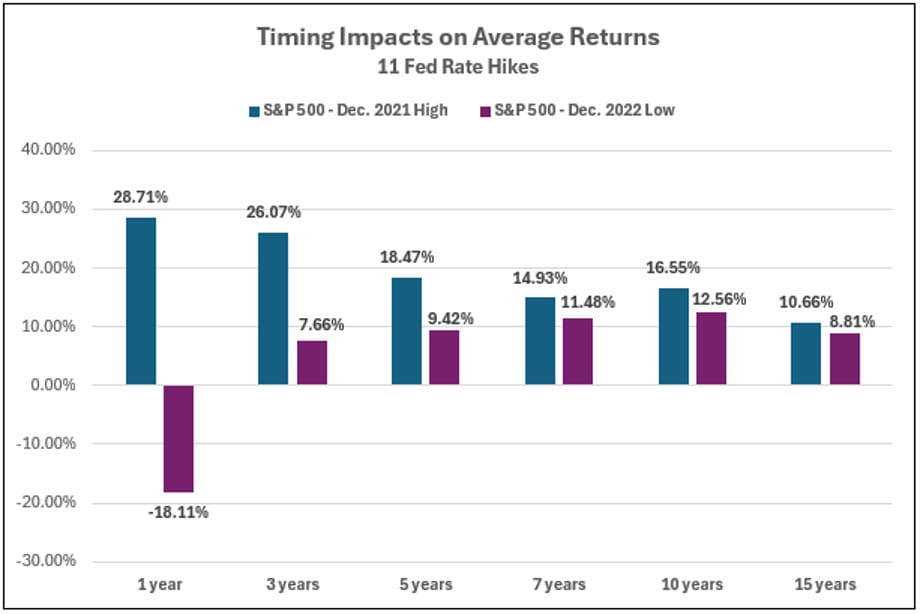
Source: Zephyr (Past Performance is no guarantee of future results)
Related Articles

What is Timing the Market?
Investment Principles,
Markets,
Top Investor Mistakes,
Top Markets FAQs,
November 3, 2023

Building a portfolio with a correction in mind vs timing the correction
Investment Principles,
Markets,
Portfolio Considerations,
October 1, 2024

How Do Recent Returns Impact Average Returns?
Investment Principles,
Top Investment Principles FAQs,
Understanding Results,
November 19, 2024