

By Stephen L. Thomas | November 3, 2023 | In
Investors often rely on average return figures as a measure of an investment’s performance over a specific period. However, it’s important to understand that recent rallies and pullbacks can significantly influence these average return numbers. In this article, we will explore how the occurrence of market rallies and pullbacks can impact average return figures, highlighting the need for a deeper analysis when evaluating investment performance.
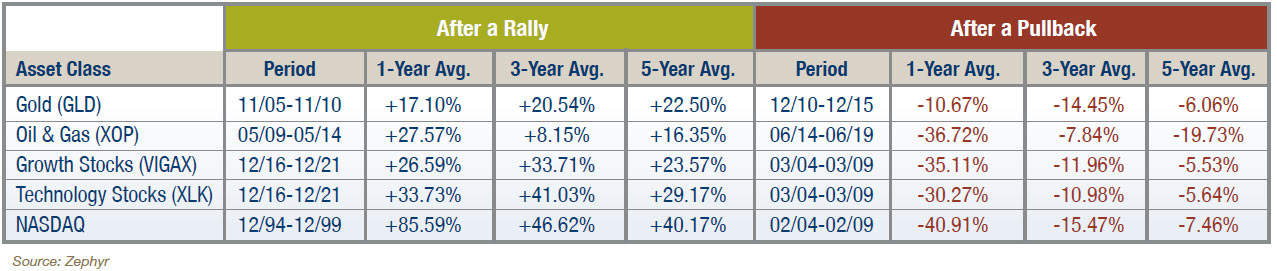
The Role of Rallies and Pullbacks
Market rallies and pullbacks are inherent features of financial markets. Rallies refer to periods of sustained upward movement in the market, characterized by increasing asset prices, higher trading volumes, and optimistic investor sentiment. Conversely, pullbacks are temporary declines or retracements in market prices, often attributed to profit-taking, market corrections, or negative economic news.
Impact on Average Return Figures
1. Magnified Average Returns During Rallies
When a market experiences a rally, it typically leads to a significant increase in asset prices over a relatively short period. As a result, the average return figures calculated during such periods can be notably higher than those calculated during more stable or downward trending markets. These inflated average returns may create an optimistic perception of an investment’s performance, potentially misleading investors into expecting similar returns in the future.
2. Dampened Average Returns during Pullbacks
Conversely, during pullbacks, when market prices decline, average return figures can be substantially lower. The negative returns during these periods can skew the overall average return downwards, potentially creating a perception of poor performance. It’s important to remember that pullbacks are often temporary and can be followed by subsequent rallies that help to recover losses.
Understanding the Nuances
To gain a more accurate perspective on investment performance, it is crucial to look beyond the average return figures and consider additional factors:
1. Volatility
Examining the volatility of an investment can provide insights into the frequency and magnitude of price fluctuations. Higher volatility can indicate the presence of both rallies and pullbacks, impacting the overall performance.
2. Time Horizon
The length of the investment period plays a significant role in assessing performance. Shorter periods may be heavily influenced by recent rallies or pullbacks, while longer periods provide a broader context for evaluating average returns.
3. Risk-Adjusted Returns
Evaluating risk-adjusted returns, such as the Sharpe ratio or the Sortino ratio, helps in assessing the investment’s performance relative to the level of risk taken. These measures provide a more comprehensive analysis by considering both returns and volatility.
4. Long-Term Perspective
Taking a long-term perspective allows investors to ride out short-term market fluctuations and better understand an investment’s performance over extended periods. It helps mitigate the impact of recent rallies and pullbacks on average return figures and provides a more accurate assessment of an investment’s potential.
Conclusion
While average return figures serve as a convenient metric to gauge investment performance, recent rallies and pullbacks can significantly influence these numbers. Understanding the impact of these market movements is crucial to avoid drawing hasty conclusions. By considering additional factors such as volatility, time horizon, risk-adjusted returns, and adopting a long-term perspective, investors can gain a more comprehensive understanding of an investment’s performance and make informed decisions based on a more accurate assessment of its potential.
Related Articles

How Quality of the Portfolio Impacts Down Market Recovery and Compounding
Investment Principles,
Top Investment Principles FAQs,
January 15, 2025

Buying the Dips
Behavior,
Investment Principles,
November 2, 2023

The Importance of Transparency and Direct Ownership for Retail Investors
Investment Principles,
Top Investment Principles FAQs,
September 17, 2024